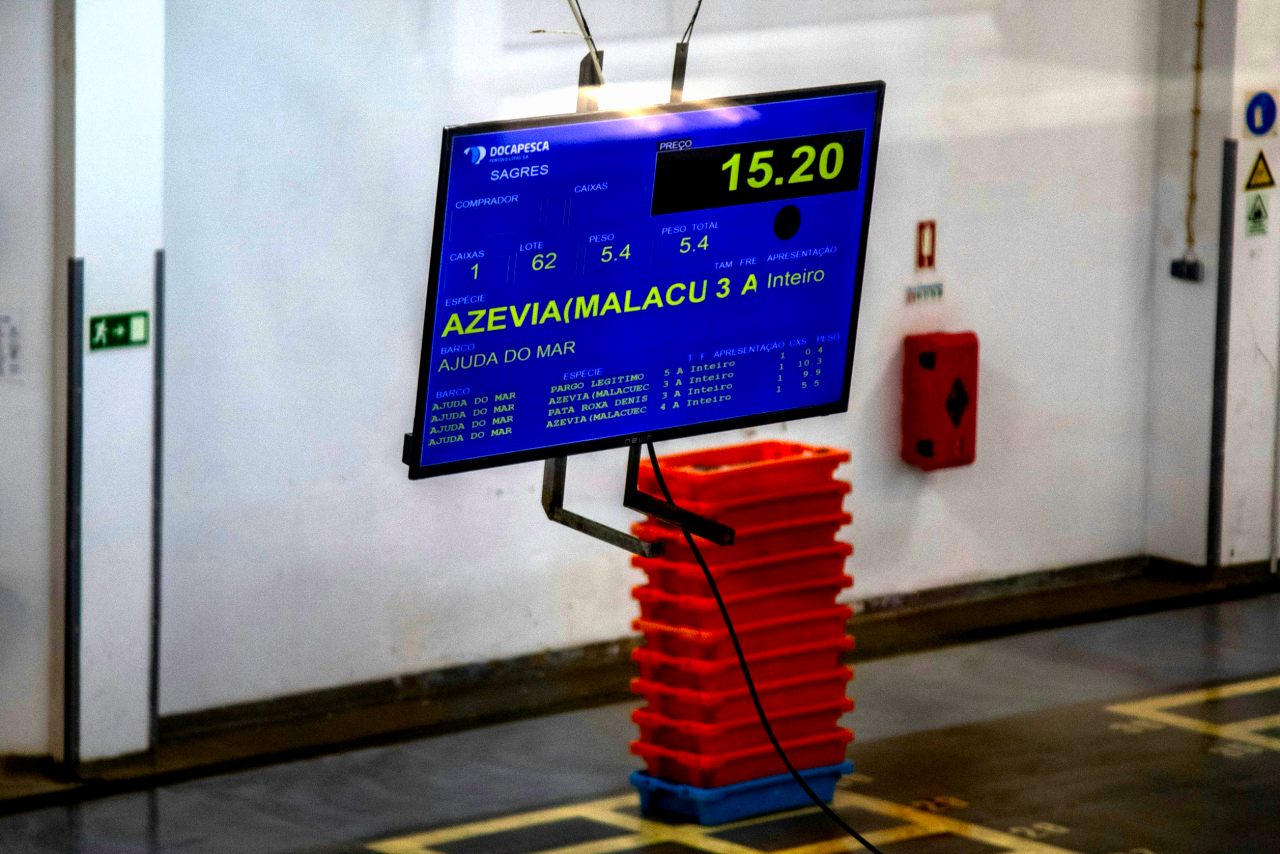
PEN01 - Why is fish so expensive? Making the ocean economy visible to everyone who depends on it
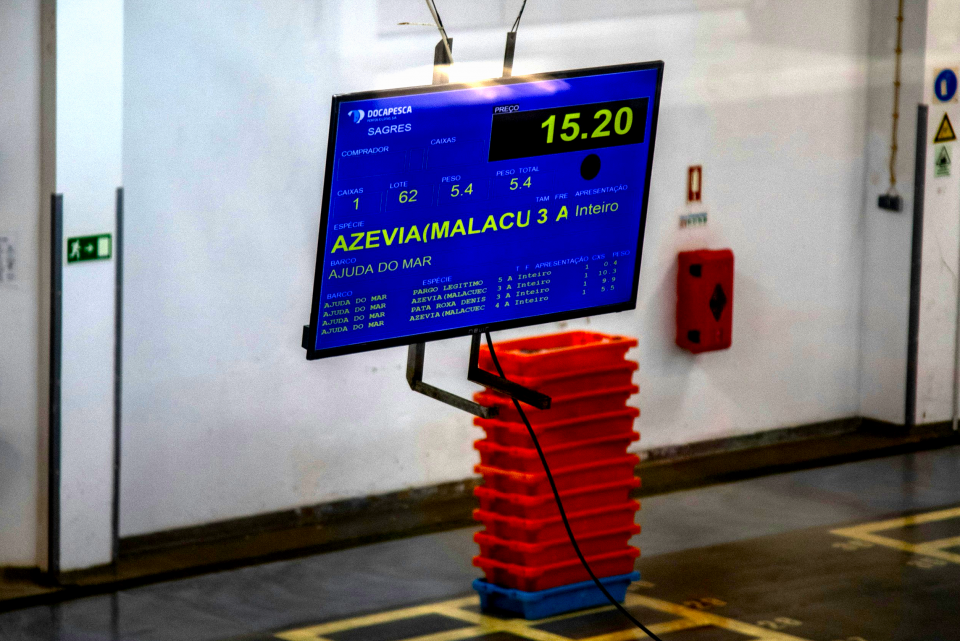
- Photo by Bernd Dittrich on Unsplash
Peniche
- Organisation
- BITCLIQ TECHNOLOGIES SA
- Diogo Silva
Portugal is one of the biggest seafood consumers in Europe. Most people who buy fish here have no real idea how the price on the shelf relates to what the person who caught it actually earned. Fishers often say they sell too cheap. Consumers often say they pay too much. Both are partly right, but the data to actually understand the gap is scattered and hard to read. Between the boat and the plate there's a lot going on: auctions, refrigeration, transport, wholesalers, retailers, taxes, seasonal swings, imports competing with local catch. Each step adds cost, and most of it stays invisible to everyone outside the industry. That invisibility is part of what creates mistrust on both ends. We want you to build something that makes this readable. Open data exists (EUMOFA, EMODnet, Docapesca, INE) covering first-sale prices, retail prices, species, seasonality, trade flows. Specific links and access points are listed in the dataset section of this submission. The angle is up to you. It could be a dashboard that follows a euro through the chain. A consumer app that explains why sardines cost what they cost this week. A storytelling piece for journalists or schools. A tool that helps a small fisher compare sales channels. Or something else entirely. You don't need a fishing background. We're looking for storytellers, designers, economists, people curious about data, developers, anyone who thinks the ocean economy deserves better explanations than it currently gets.
You want to join the team:
- What the challenge owner would like to develop over 48h
- A working prototype. The format is open: a web or mobile app, an interactive data visualisation, an educational game, a storytelling piece. What matters is that by Sunday afternoon there's something demonstrable, built on real open data, aimed at a clear audience the team picks itself — consumers, fishers, journalists, students, regulators. The team decides the format based on the skills it ends up having.
- Which skills the challenge owner is looking for
- The challenge is more about making something complex understandable than about hard technical work, so the team needs a mix of perspectives more than a specific list of tools. Useful profiles include:
Storytellers and communicators, designers (UX, visual, data viz, illustration), people with relevant domain interest (economists, sociologists, marine biologists, anyone who has thought about food chains or coastal communities), and analysts comfortable digging into datasets even with just spreadsheets or no-code tools.
Having one or two people with technical skills in the team will help a lot when it comes to actually building the prototype — someone who codes in Python, JavaScript, or works with data tools. But the team shouldn't be all developers. The interesting work here is in framing, design, and how the final product tells its story.